swexler

About Steve Wexler

This author has not yet filled in any details.
So far Steve Wexler has created 198 blog entries.

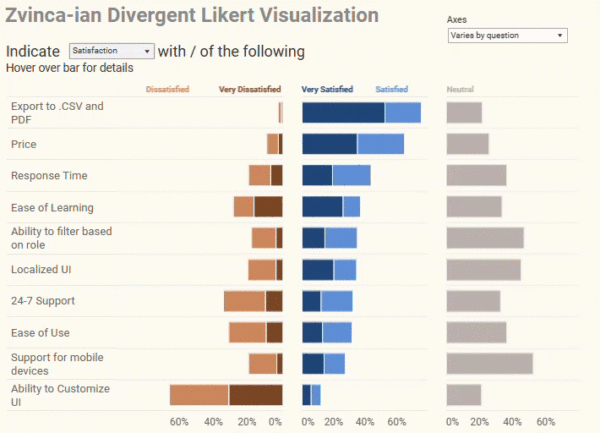
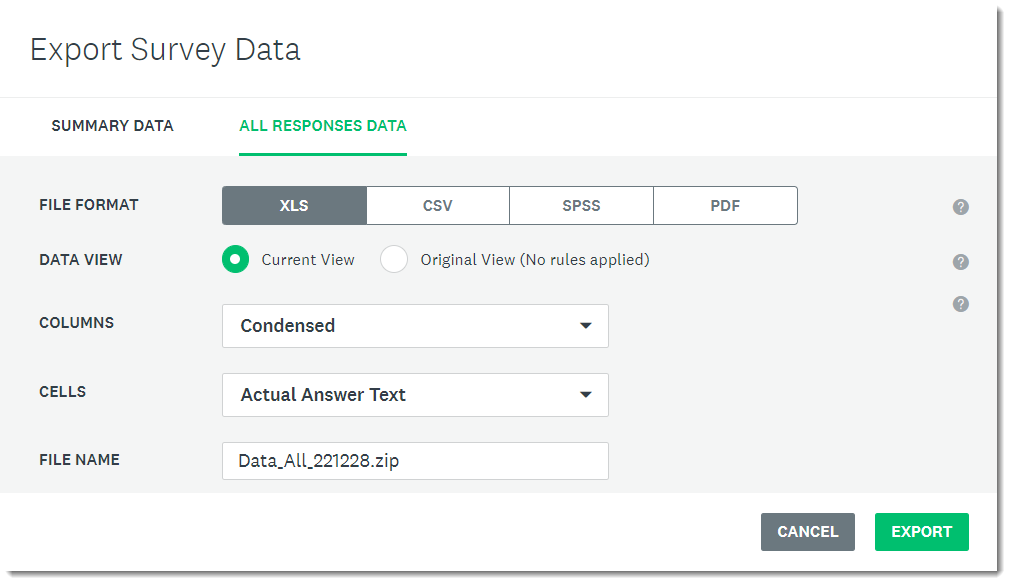
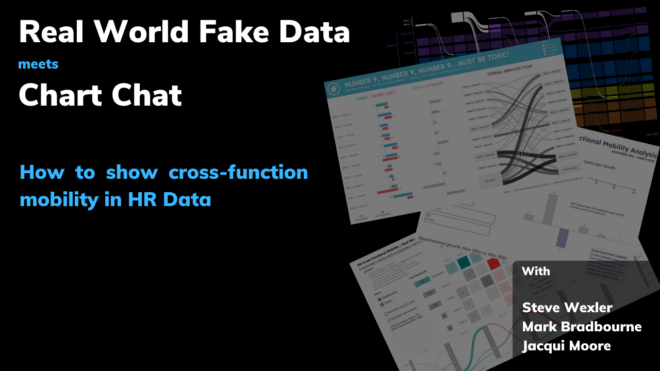
Cross-Function Mobility Recap

By |2023-08-09T15:57:25+00:00August 7th, 2023|Business Visualizations, Chart Chat, Makeovers|

Here's a recording and recap of Real World Fake Data meets Chart Chat: Showing cross-function mobility in HR data https://www.youtube.com/live/ZAxzJwyBuOk?feature=share 0:00 Introduction and Agenda 2:06 Backstory / Data 10:45 Assumptions, omissions, questions 14:09 Steve's initial take 16:30 Nicole Lillian Mark's submission 25:40 Dennis Kao's submission 33:10 Kevin Flerlage's submission 38:50 Andrzej Leszkiewicz's submission 50:10 [...]

Likert Scale Questions the Zvinca Way

By |2023-07-24T17:35:46+00:00June 13th, 2023|Business Visualizations, Makeovers, Visualizing Survey Data|

Overview Although I was on vacation in April of 2023, I did see this twitter post. Daniel Zvinca’s response knocked my socks off. Here’s the post from Cole Knaflic. And here was Daniel’s response. “Goodness, yes” I thought. This addresses the shortcomings of what I’ll call the “inside out” approach for displaying Likert scale survey [...]

2006—A Banner Year for Presentations Featuring Data Visualization

By |2023-03-01T19:25:10+00:00March 1st, 2023|Business Visualizations, Chart Chat, General Discussions|

In chatting with Seth Godin and Jasper Croome during one of last year’s Chart Chat episodes I realized that three of my all-time favorite presentations and videos that feature data visualization were all created in 2006. And they all hold up. Hans Rosling’s 2006 TED talk Rosling was a Swedish professor of Global Health who, using data, [...]

Getting SurveyMonkey data to play nicely with Tableau

By |2023-01-04T17:11:55+00:00January 3rd, 2023|Business Visualizations, Visualizing Survey Data|

I’ve received a lot of requests to address the unique (and annoying) issues with getting SurveyMonkey data to play nicely with Tableau. The good news is that once you know where the stumbling blocks are it’s not very difficult to get your data “just so” so that you can create clear visualizations that provide solid [...]