Speaking
Tips, Tricks, Techniques (and maybe a Motown bassline)
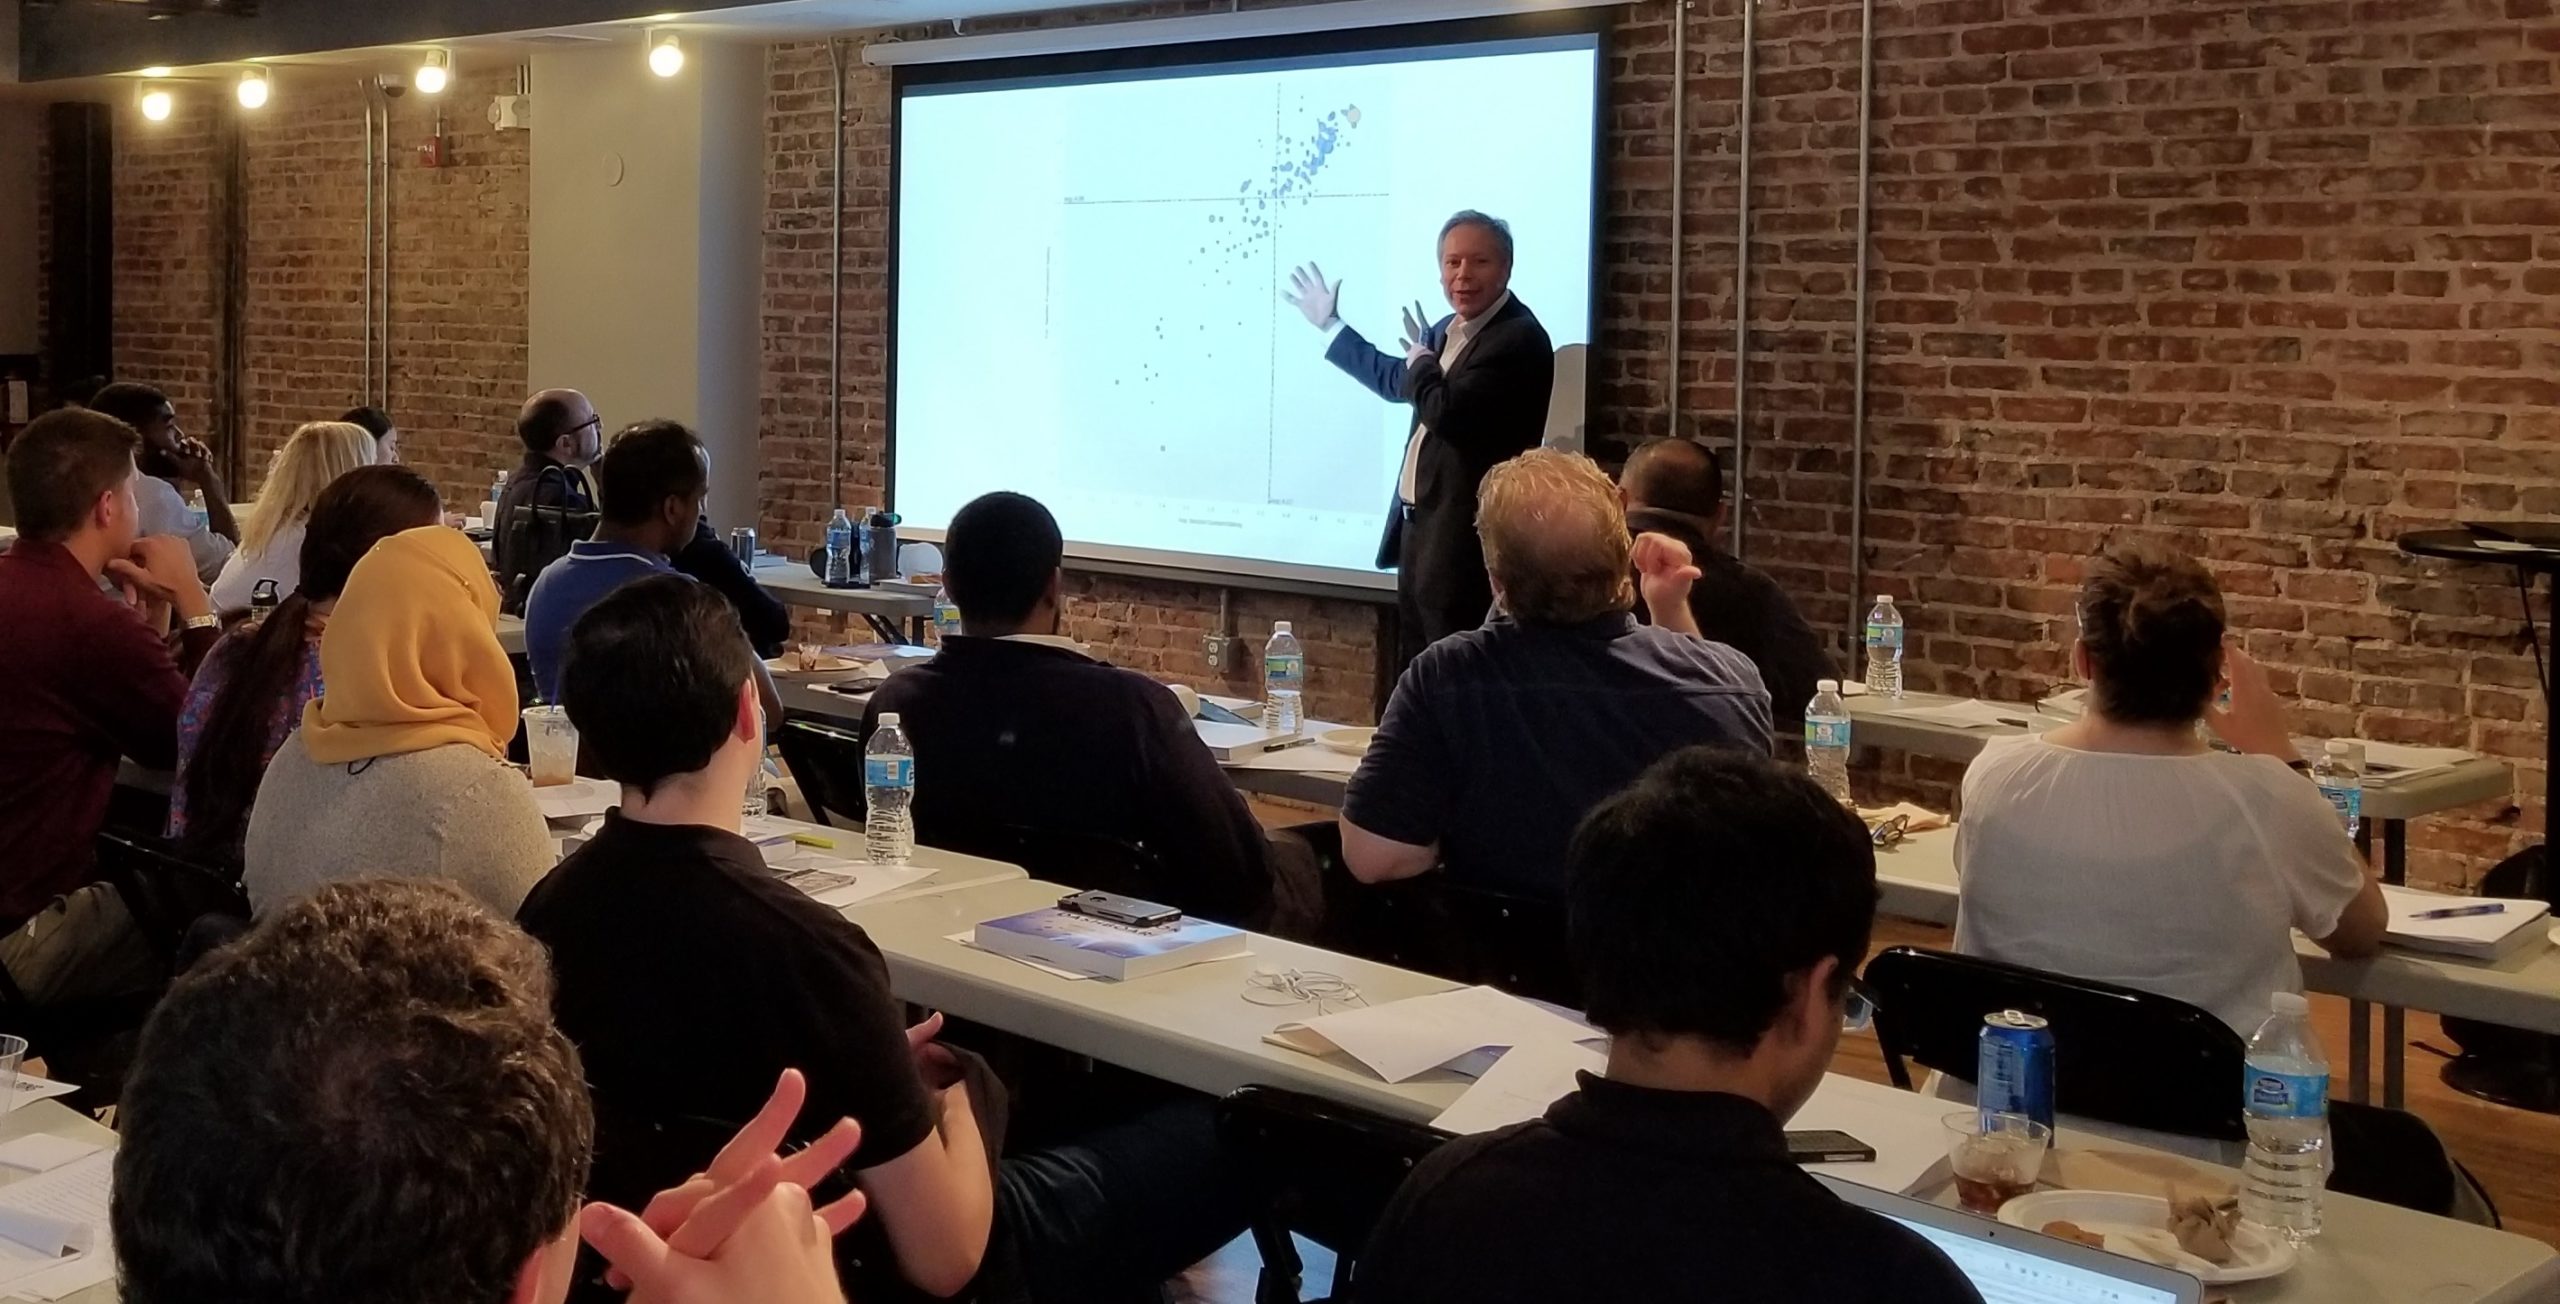
Wells Fargo Learning Center on the Green 301 S Tryon St, Charlotte, NC, United StatesSteve will show some of his favorite Tableau tips and tricks as well as answer questions about anything you want to know (e.g., dashboard design, Storytelling, IronViz, Salesforce acquisition, Motown basslines, etc.)
Chart Chat Live — Round 11
Watch as Jeffrey Shaffer, Steve Wexler, Amanda Makulec, and Andy Cotgreave, debate the good, the bad, and the “screaming cats” of data visualization. By tuning in you’ll learn how to apply their thought processes to your own work. You’ll be entertained, and you’ll build better data visualizations. Format: 5-minute recap, 20-minute presentation, 10-minute "lightning" round, [...]
Chart Chat Live — Round 12
Watch as Jeffrey Shaffer, Steve Wexler, Amanda Makulec, and Andy Cotgreave, debate the good, the bad, and the “screaming cats” of data visualization. By tuning in you’ll learn how to apply their thought processes to your own work. You’ll be entertained, and you’ll build better data visualizations. Format: 5-minute recap, 20-minute presentation, 10-minute "lightning" round, [...]
Chart Chat Live — Round 13
Watch as Jeffrey Shaffer, Steve Wexler, Amanda Makulec, and Andy Cotgreave, debate the good, the bad, and the “screaming cats” of data visualization. By tuning in you’ll learn how to apply their thought processes to your own work. You’ll be entertained, and you’ll build better data visualizations. Format: 5-minute recap, 20-minute presentation, 10-minute "lightning" round, [...]
Chart Chat Live — Round 14
Watch as Jeffrey Shaffer, Steve Wexler, Amanda Makulec, and Andy Cotgreave, debate the good, the bad, and the “screaming cats” of data visualization. By tuning in you’ll learn how to apply their thought processes to your own work. You’ll be entertained, and you’ll build better data visualizations. Format: 5-minute recap, 20-minute presentation, 10-minute "lightning" round, [...]
Using data visualization to make better decisions–faster
Online NY, United StatesIn this live webinar, Tableau Zen Master and best-selling author Steve Wexler will share insights on how to get your organization to "get" data visualization.
Chart Chat Live — Round 15
Watch as Jeffrey Shaffer, Steve Wexler, Amanda Makulec, and Andy Cotgreave, debate the good, the bad, and the “screaming cats” of data visualization. By tuning in you’ll learn how to apply their thought processes to your own work. You’ll be entertained, and you’ll build better data visualizations. Format: 5-minute recap, 20-minute presentation, 10-minute "lightning" round, [...]
Inspiring change with data visualization
Online NY, United StatesIn this live webinar, see real-world examples, free of esoteric chart types, that people employed to change the way their organizations did business.
Chart Chat Live — Round 16
Watch as Jeffrey Shaffer, Steve Wexler, Amanda Makulec, and Andy Cotgreave, debate the good, the bad, and the “screaming cats” of data visualization. By tuning in you’ll learn how to apply their thought processes to your own work. You’ll be entertained, and you’ll build better data visualizations. Topic: 2020 Election Trackers Register
Inspiring change with data visualization
Online NY, United StatesIn this live webinar, see real-world examples, free of esoteric chart types, that people employed to change the way their organizations did business.


