Steve’s Blog

What’s wrong with Iron Viz, and how to fix it

By |2020-02-15T21:14:13+00:00March 14th, 2019|Business Visualizations, General Discussions|

March 14, 2019 Overview Since 2011 a highlight of Tableau’s annual conference is “Iron Viz,” a data visualization competition loosely based on “Iron Chef.” The premise of the Tableau contest is that three contestants who have won feeder competitions have 20 minutes to build a fully functional, interactive dashboard from scratch, with each contestant [...]

Chart Chat Live — Round 3

By |2020-03-28T23:36:08+00:00February 19th, 2019|Business Visualizations, Chart Chat, Videos|

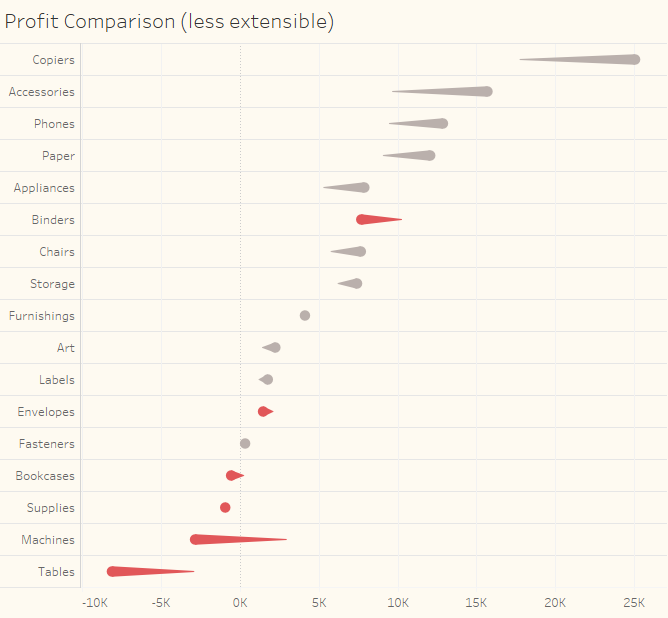
Chris Love joins Steve and Jeff as they discuss Lollipop charts (again) Bar (chart) hopping Name the author Things that delighted Things that dismayed More on population pyramids (and the community offering some amazing alternatives, particularly from Chris Love) Critical thinking in data analysis https://youtu.be/thuwAYphPVs

More about Population Pyramids (and why this community is amazing)

By |2024-09-13T14:22:05+00:00February 6th, 2019|Business Visualizations, General Discussions, Makeovers|

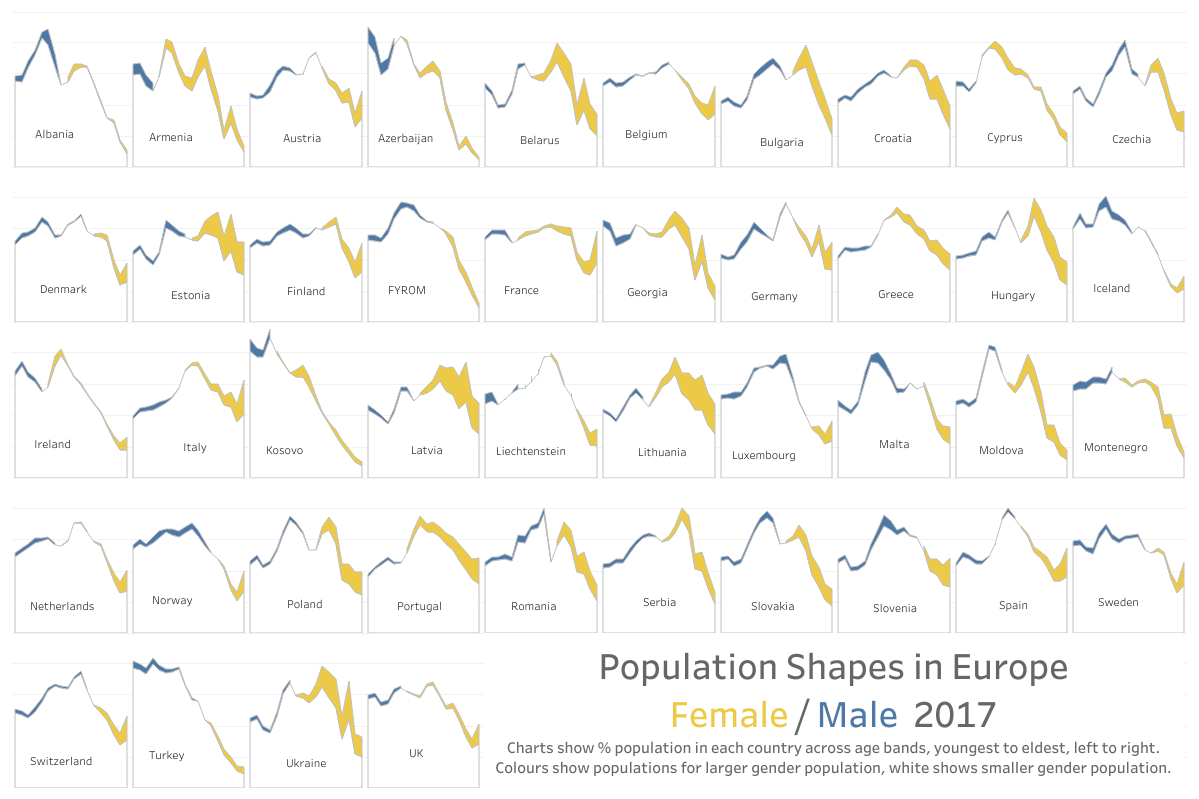
February 6, 2019 My earlier post on why I don’t like Population Pyramids generated a lot of communication on twitter and this communication lead to what I think is an elegant and analytically solid offering from Chris Love.  His contribution was in the result of iterating and collaborating with several people, including Dorian Banutoiu [...]

Good enough, good enough, good enough, and *not* good enough

By |2020-02-15T21:49:08+00:00January 21st, 2019|Business Visualizations, General Discussions, Makeovers|

Some thoughts on why pursuing the perfect chart is not a great use of your time January 22, 2019 Background During Chart Chat (Round Two) I discussed my affection for the lollipop chart and why I thought it was an acceptable alternative to the bar chart. My friend and colleague, Chris Love, was watching [...]

Chart Chat Live — Round 2

By |2020-03-28T23:37:46+00:00January 8th, 2019|Business Visualizations, Chart Chat, Videos|

Jeff and Steve discuss Jeff's makeover of the Nightingale "Rose" chart Lollipop charts Getting feedback from your audience (so you can see with fresh eyes) Joey Cherdarchuk from Dark Horse Analytics Pie Charts and Bar Charts living in harmony Padding in dashboards "Guess the author" Sankey diagrams Embellishments in music and dashboards Population pyramids [...]